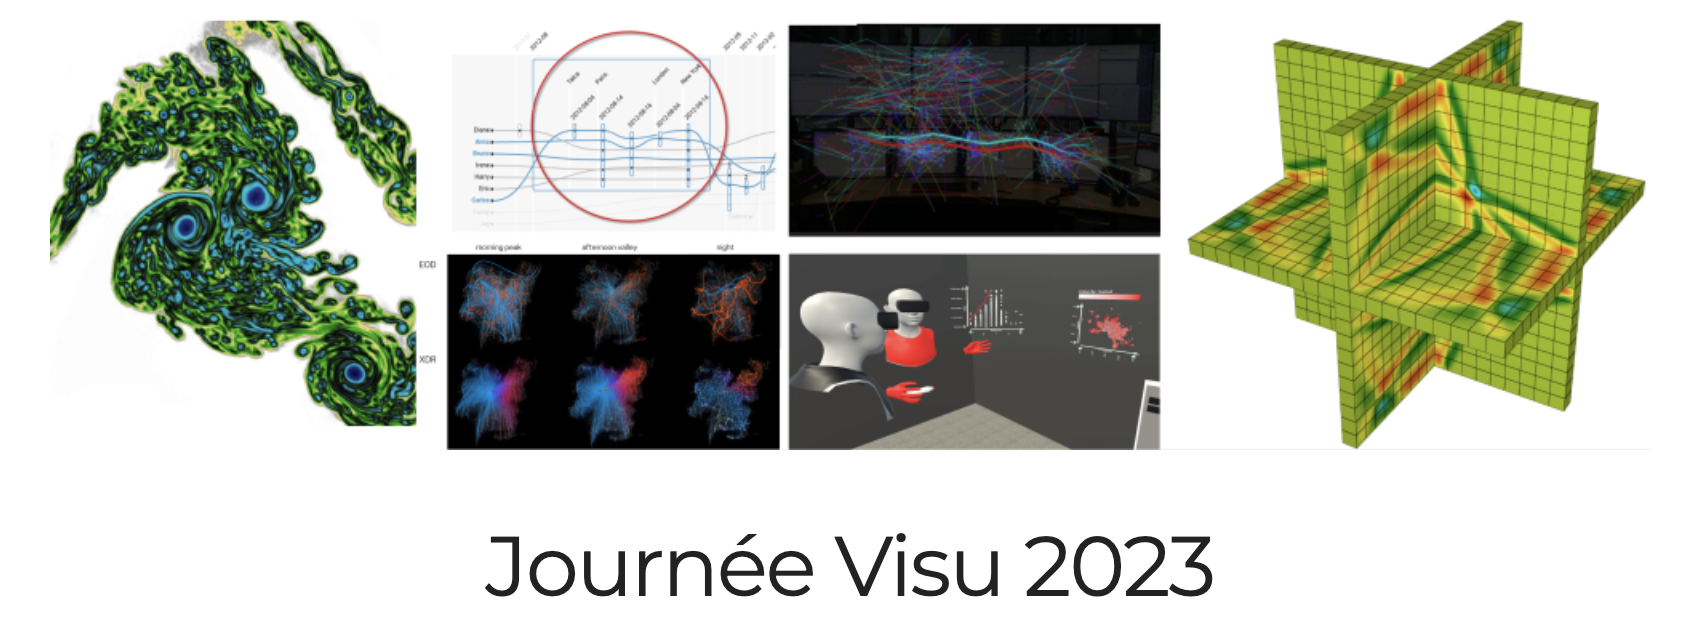
Cette année, la journée Visu2023, organisée par Vanessa Penã-Araya (ILDA), Florent Cabric (AVIZ) et Inria Saclay, aura lieu le 22 Juin 2023 à l'Institut de Mathématiques d'Orsay, de 8h30 à 18h.
Benjamin Bach Reader (Associate Professor) à l'Université d'Edimbourg introduira la journée par un exposé sur le thème "Designing for Understanding: How to Empower People to Create Visualizations?".
9:00 - Accueil
9:30 - Introduction de la journée
9:45 - Keynote: Benjamin Bach (Université d'Édimbourg) "Designing for Understanding: How to Empower People to Create Visualizations?"
Résumé : This talk wants to discuss approaches to helping people create and design data visualizations. From climate data to peace and conflict mitigation, people are understanding the power of good visualizations for analysis and communication. Consequently, more and more people want to create and design visualizations as part of their personal and professional lives. To this end, they can rely on a growing number of textbooks, visualization tools, and course offers. Yet, many people simply don't have the time and bandwidth to engage with courses, choose among and try different tools, and piece together knowledge from various resources to solve their own cases. This talk calls for more accessible and inclusive approaches to data visualization to help make visualizations more usable and used. I will discuss approaches to visual communication and guidance for exploration, online tools, as well as design patterns and programming toolkits for dashboards and network visualization. The talk will conclude with a discussion of challenges in the education of visualization and a respective call to action.
Bio : Benjamin is a Reader (Associate Professor) in Design Informatics and Visualization at the University of Edinburgh. He established and is now co-leading the VisHub Lab. His research investigates more effective and efficient data visualizations, interfaces, and tools for data analysis, communication, and education. He is regularly collaborating with social scientists, historians, biologists, peace reserachers, and public organizations. Benjamin was named Significant New Researcher by the IEEE VIS conference (2021) and Eurographics Young Researcher (2019). His PhD received a VGTC Best Thesis honorable mention award (2014). Before joining the University of Edinburgh, Benjamin was a postdoc at Harvard University (Visual Computing Group), Monash University (Immersive Analytics Lab), Microsoft-Research, and a visiting scholar at the Brain Imaging Center at the University of Washington. Benjamin is an active member of the programme and organization committees of the primer venues for visualization (IEEE VIS) and human-computer interaction (ACM CHI).
10:45 - Pause offerte par Kitware
11:10 - Session: Applications
- Aymeric Erades et Romain Vuillemot "Visual Analysis of Table Tennis Game Tactics"
- Renaud Blanch, Albanne Lecointre, Michael Ortega et Philippe Roux "Visualisation de données spatio-temporelles: Étude sismologique du glacier d’Argentière"
- Nesrine Fourati, Mathieu Chollet et Chloé Clavel "Intuitive Visualisation of Prosodic Variations for Public Speaking Coaching"
- Philippe Rivière "Interpolation spatiale dans Observable Plot "
12:10 - Pause déjeuner + Posters et Démos
13:40 - Session: Visualisation scientifique
- Julien Fausty, Charles Gueunet, Mathieu Westphal et François Mazen "Challenges in visualizing results from more modern finite element formulations: high-order, DG, H(div), H(curl)..."
- Mathieu Pont, Jules Vidal et Julien Tierny "Analyse en Géodésiques Principales d’Arbres de Fusion (et de Diagrammes de Persistance)"
- Margaux Mouchené, Renaud Blanch, Erwan Pathier et Franck Thollard "InSARViz: an open source interactive visualization tool for InSAR"
- Maryam Boumrah, Samir GARBAYA et Amina RADGUI "Optimization of Data Flow and Display for Real-Time Visualization of Clinical Data"
14:40 - Pause offerte par DATAIA
15:00 - Session: Information Visualisation et Interaction
- Éric Languenou "Tailles et couleurs des objets voisins pour une séparabilité visuelle"
- Anne-Flore Cabouat, Tingying He, Petra Isenberg, Tobias Isenberg "Pondering the reading of visual representations"
- Gabriela Molina León, Petra Isenberg, and Andreas Breiter "Eliciting Multimodal Interactions for Data Exploration on Large Vertical Displays"
16:00 - Pause
16:20 - Panel de prospective
17:20 - Conclusions de la journée
- Lonni Besançon, Florian Echtler, Matthew Kay et Chat Wacharamanotham : Une nouvelle vision pour l’édition scientifique?
- Katerina Batziakoudi et Jean-Daniel Fekete - Budget Understanding : From tables to hierarchical visualizations
- Margaux Mouchené, Renaud Blanch, Erwan Pathier et Franck Thollard - InSARViz : an open source interactive visualization tool for InSAR
- Iskandar Boucharenc, Sahar Ghannay, Christophe Servan, Laure Soulier et Sophie Rosset : Étude de l’adaptation des gros modèles de langues par retour visuel
- Agathe Goret, Véronique Guidicelli, Laurence Berthou-Soulie, Pierrick Rival, Patrice Duroux, Catherine Prades et Sofia Kossida - VISIMMU : Explorer et visualiser la réponse immunitaire spécifique après immunisation


